
Examples of SQL queries
Analysis of Google Analytics table data in BigQuery.
Hi👋, I'm Dmitry Shirikov,
a Data Analyst with proficient Programming and Data Visualization skills.
I am a data analyst with proficient Programming and Data Visualization skills.
My technical expertise includes data collection, engineering, visualization, and the application of machine learning algorithms. For my work, I use Python libraries such as Pandas, Plotly, Scikit-learn, and Selenium, as well as SQL, Tableau, Power BI, and Excel.
Analysis of Google Analytics table data in BigQuery.
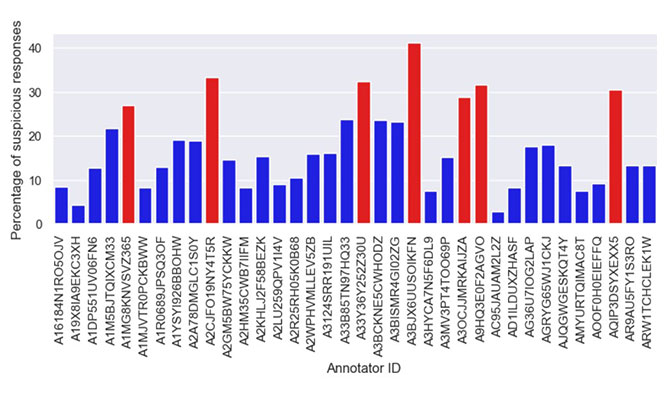
This project aims to address the challenge of identifying data that has been annotated by bots. Since identifying untrustworthy annotators relies on their responses, the goal is to develop a solution that effectively filters out such bot-generated annotations, enhancing the overall quality and reliability of the annotated data.
Developed a binary classifier to identify and filter out harmful and offensive comments. Leveraged technologies such as NLTK, Pandas and scikit-learn for text preprocessing, scikit-learn for model training, and implemented a robust pipeline for seamless processing.
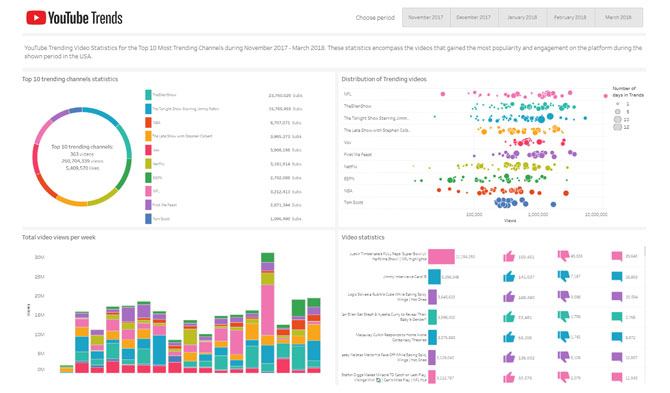
YouTube Trending Video Statistics for the Top 10 Most Trending Channels during November 2017 - March 2018. These statistics encompass the videos that gained the most popularity and engagement on the platform during the shown period in the USA.

I utilized web scraping tools such as Selenium and BeautifulSoup to extract Spotify data. Then, I used Matplotlib and Wordcloud libraries for data visualization, enabling the representation of the most frequently used words in the music of each artist. This visualization reveals the mood and vibe that the singer conveys through their lyrics.
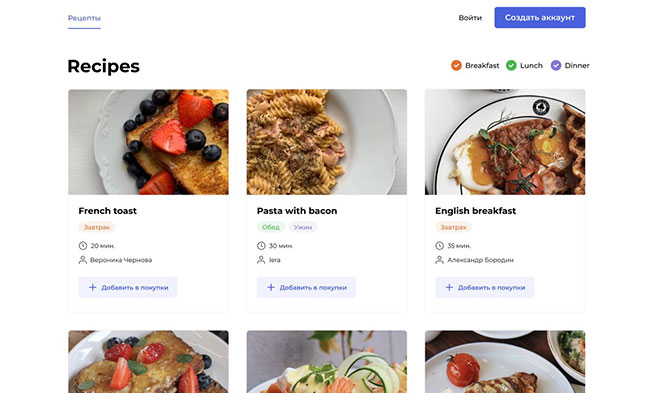
This project involves backend development for a Recipe and Shopping List Blog. It utilizes the Django REST framework and PostgreSQL database. The deployment was accomplished on Yandex Cloud through Docker containers and Nginx server, with continuous integration and deployment managed by GitHub Actions.

This project is about creating a bot that uses Yandex API. The bot checks homework updates polling Yandex Practicum API endpoint. It can spot errors, keep a log, and sends messages when homework status changes or errors occur.

The ability to quickly find descriptions of functions enables every data scientist to work productively without losing the state of flow. That's why I've created a cheat sheet for Pandas, including the most commonly used functions and queries for exploratory data analysis and machine learning model building.
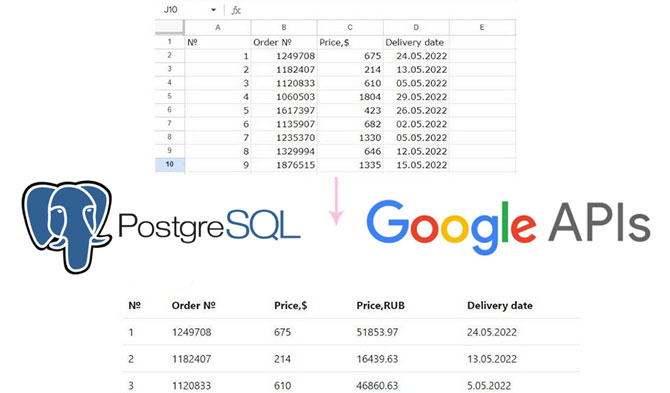
This project involves developing a script that uses the Google API to fetch real-time data from a Google Sheets document. The data is then transferred to a PostgreSQL database using Django. The entire application is containerized using Docker for easy deployment and scalability.

©Dmitry Shirikov